Epic and Feature burndown charts
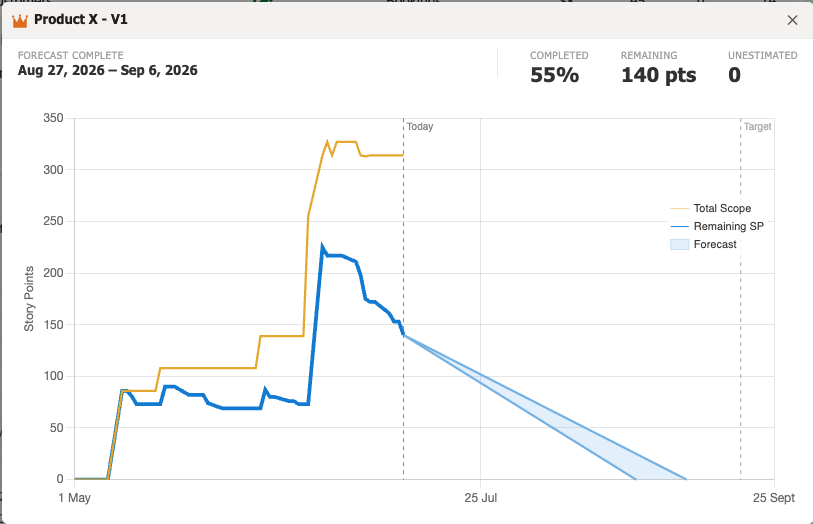
OKRsignal can generate a burndown chart for each Epic and Feature connected to the OKR. The chart shows how remaining story points and total scope are changing over time and overlays the forecast completion window so you can see at a glance whether delivery is tracking to plan.
Viewing the burndown chart
Click the burndown chart icon on any Epic row in the Epics section to open the chart.
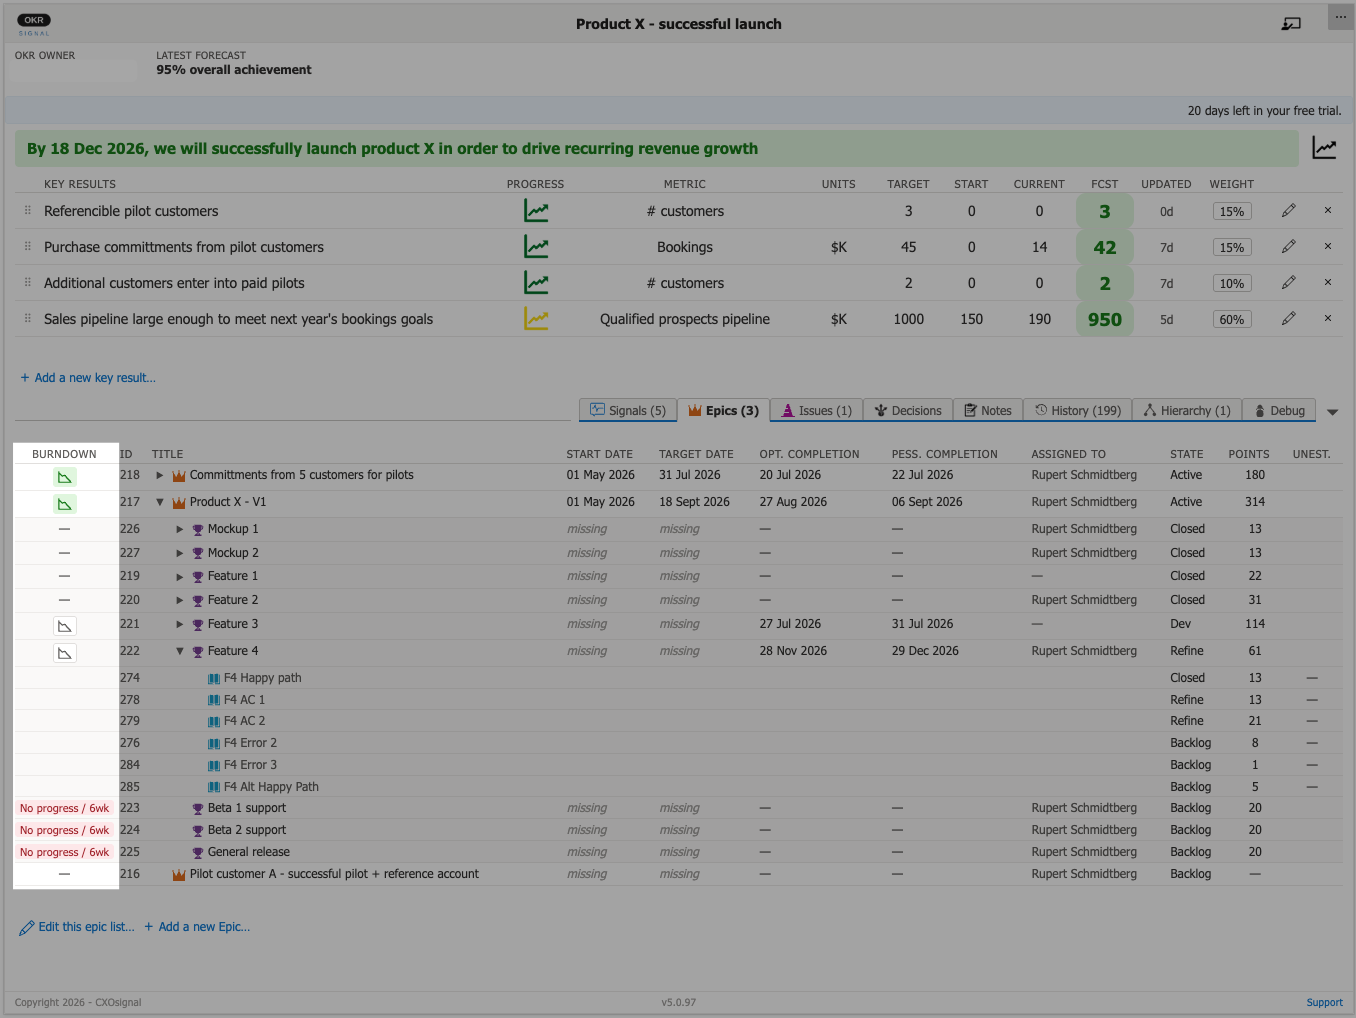
The chart shows:
- Total scope — how the total amount of work (completed and remaining combined) changes over time
- Actual burndown — the historical line of remaining story points from the Epic's start date to today
- Forecasted completion dates — the shaded band between the estimated optimistic and pessimistic completion dates
- Target date — a vertical line showing the Epic's Due Date
Feature-level burndown
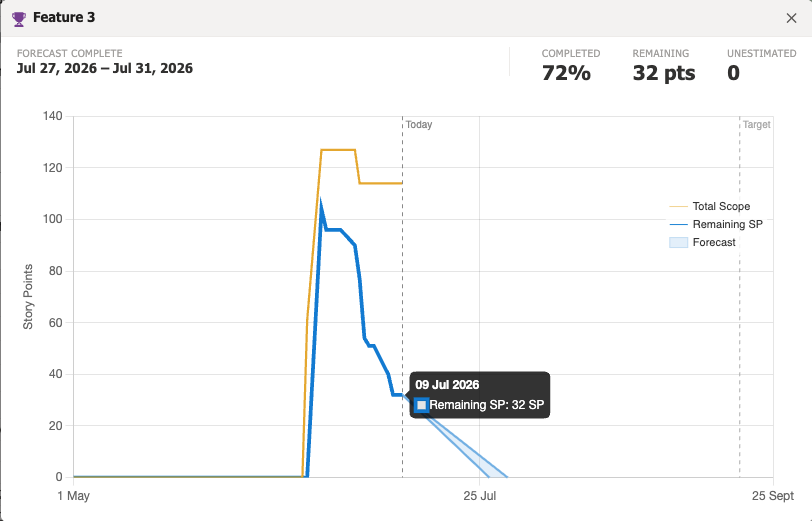
In addition to the Epic-level chart, OKRsignal can display the burndown for individual Features. This lets you see how work on a specific Feature is progressing. Click the burndown icon next to a Feature to show its burndown chart.
Was this article helpful?